Voor het eerst zijn er betrouwbare statistieken over online werk
De Online Labour Index (OLI) is de eerste economische indicator die statistieken weergeeft over de online ‘gig economie’ op vergelijkbare wijze zoals dat voor traditioneel werk gebeurt. De index meet vraag en aanbod van online freelance werk over landen en beroepen heen. De gegevens komen van online platformen in real time.
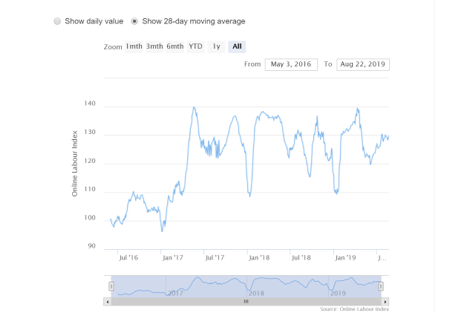
De metingen zijn in mei 2016 gestart zodat er nu gegevens over ruim 2 werkjaren beschikbaar zijn. Het aantal opdrachten op die eerste dag in 2016 kreeg de index 100 mee en alle afwijkingen zijn percentages ten opzichte van deze startwaarde. De voorbije 2 jaar zijn er telkens pieken tot +40% in aanvragen geweest.
Je kan de Online Labour Index gratis raadplegen op http://ilabour.oii.ox.ac.uk/online-labour-index/
De verdere uitleg over de index nemen we bij deze over van hun website (Engels):
The Online Labour Index is produced by Otto Kässi and Vili Lehdonvirta as part of the iLabour project at the Oxford Internet Institute. The visualization is developed in collaboration with Martin Hadley from the University of Oxford Interactive Data Network. The data set and visualization are made available on a CC-BY license. You are free to use them in other publications as long as you credit the authors.
Using the Online Labour Index
The visualization used let you explore the OLI. It shows how the utilization of online labour varies over time and across countries and occupations. The index is normalized so that 100 index points on the y-axis represents the daily average number of new projects in May 2016. For instance, you can see that by September 2016, the utilization of online labour had increased by around nine index points (ie. 9%) from May.
Read more about the insights that can be derived from the OLI here and here.
How the Online Labour Index is constructed
The OLI is constructed by tracking all the projects/tasks posted on the five largest English-language online labour platforms, representing at least 70% of the market by traffic. The projects are then classified by occupation and employer country. The results are published as an automatically updated open data set here. Read more about the methodology here.
Online Labour Index worker supplement
Since July 2017, we also track where in the world online gig work gets done, by observing workers active on four major online labour platforms. The visualization allows you to explore how the supply of different types of work is spread across the globe.
Read more about what insights can be derived from the worker data here.
Read about the methodology of the worker supplement here. View the visualization in a separate window here.


You must be logged in to post a comment.